نمای هفتگی بیت کوین!
BTC / USD
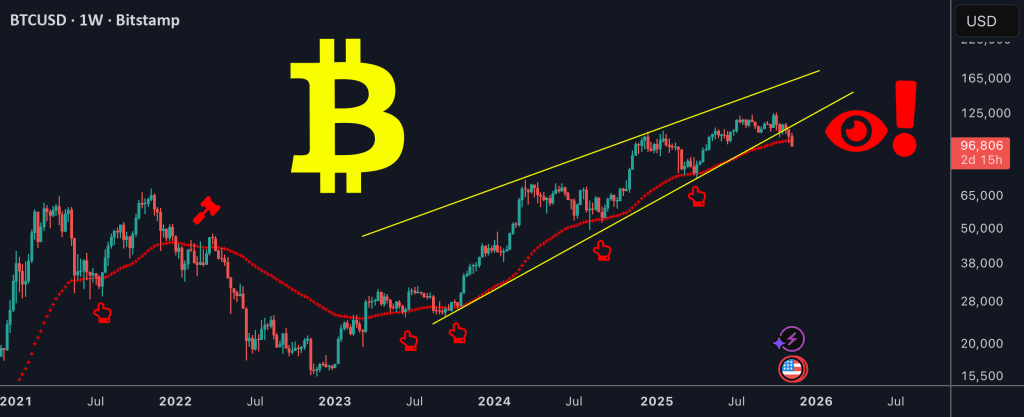
Bitcoin (BTC) followed my previous analysis on October 30th, dropping from
$۱۱۰,۰۰۰ to its current price of $96,000. check here
What’s Next?
Take a Look at the weekly chart:
Bitcoin is currently at a “do or die” support level (trend line + 50-week moving
average).
This moving average has been a turning point in previous cycles.
If the price breaks below this level, it will confirm a mid-term bear trend with
minimal target around 74k so keep an eye on this chart.
منبع: تریدینگ ویو